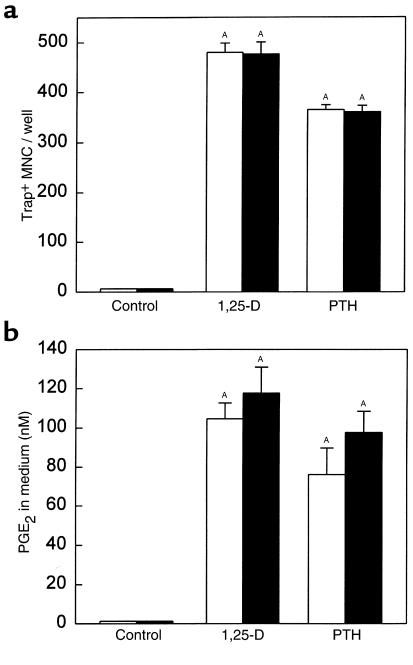
Figure 3.
Effect of PGHS-1 gene disruption on TRAP+ MNC formation and PGE2 production in marrow culture. Marrow from PGHS-1 knockout mice (black bars) or from wild-type littermates (white bars) was cultured with vehicle (Control) or 1,25-D (10 nM) for 7 days. (a) Bars represent mean ± SE for TRAP+ MNC in 4 wells. (b) Bars represent mean ± SE for medium PGE2 produced during the last 2 days of culture in 4 wells. ASignificant difference from control group; P < 0.01.

