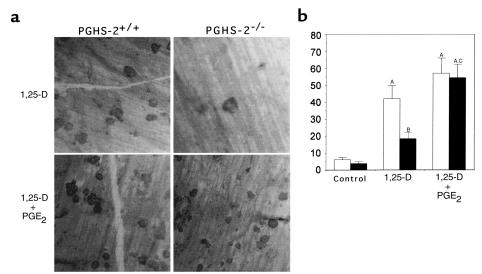
Figure 5.
Formation of resorption pits on cortical bone slices by cultured marrow cells from PGHS-2+/+ mice (white bars) and PGHS-2–/– mice (black bars). Cultures were treated with either vehicle (Control) or 1,25-D (10 nM) with and without PGE2 (1 μM). An osteoclast resorption pit was defined as having multiple overlapping resorption lacunae. (a) Photomicrograph of resorption pits on cortical bone. (b) Number of resorption pits counted on 6 bone slices (mean ± SE). ASignificant difference from control group; P < 0.01. BSignificant difference from 1,25-D–treated PGHS-2+/+ cells; P < 0.05. CSignificant effect of addition of PGE2; P < 0.01.

