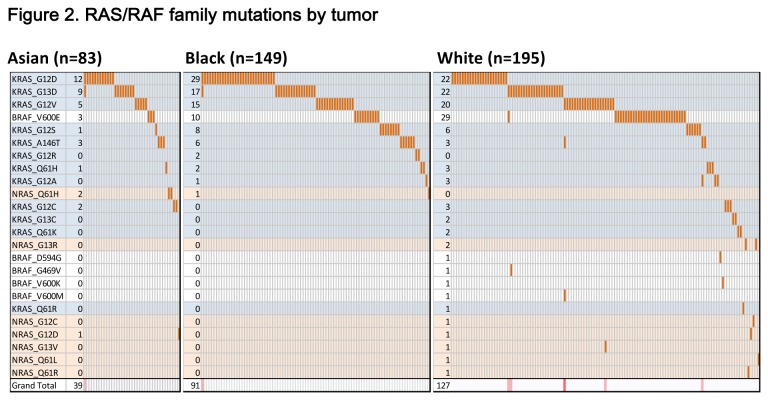
Figure 2. RAS/RAF family mutations by tumor and gene.
A summary chart of all RAS/RAF mutations in each patient group displays genes across in rows and tumors down in columns. The bottom row of each represents the total number of mutations per tumor as a heat map (0-5 mutations). Chart A displays Asian patients, chart B, Black patients and chart C, White patients.

