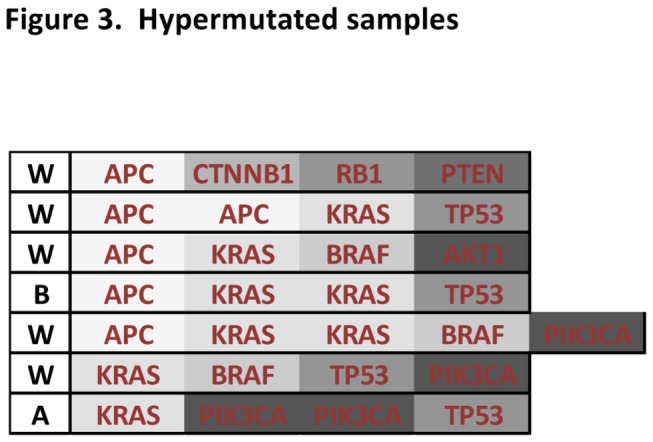
Figure 3. Hyper-mutated samples.

Represented here are the genes mutated in the 7 patient samples that each have four or more mutations. A, W and B represent tumors from Asian, Black or White tumors, respectively.

Represented here are the genes mutated in the 7 patient samples that each have four or more mutations. A, W and B represent tumors from Asian, Black or White tumors, respectively.