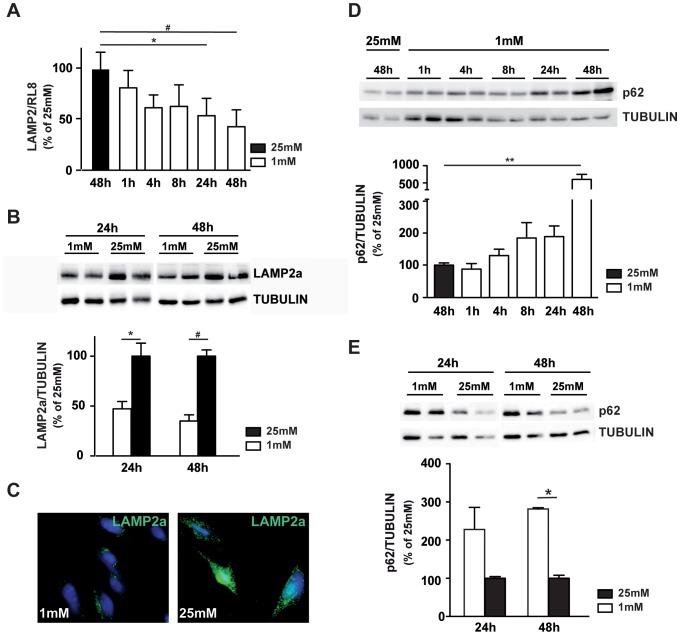
Figure 4. Low glucose induces a decrease in LAMP2 expression.
661W cells were cultured as mentioned in material & methods, and then incubated at low (1 mM) or high (25 mM) glucose for diverse periods of time. A) Quantification of Lamp2 mRNA by qPCR analysis, RL8 gene was used to normalize gene expression. Results are expressed as mean ± SEM of 3 experiments, * p<0.02 and # p<0.0008. B) Western blot analysis of LAMP2a protein expression. Results are expressed as mean ± SEM of 3 experiments, * p<0.03 and #p<0.001. C) Immunofluorescence staining of LAMP2a (green) in 661W cells cultured at 1 mM and 25 mM glucose concentration. D) Western blot analysis and quantification of p62 in 661W cells, western blot is representative of three experiments performed in triplicate and results are expressed as mean ± SEM, ** p<0.0011. E) Western blot and quantification of p62 expression in retinal explants, cultured at 1 mM or 25 mM glucose. Western blot is representative of 2–3 experiments and results are expressed as mean ± SEM of 5 different retinas for each condition, * p<0.002.

