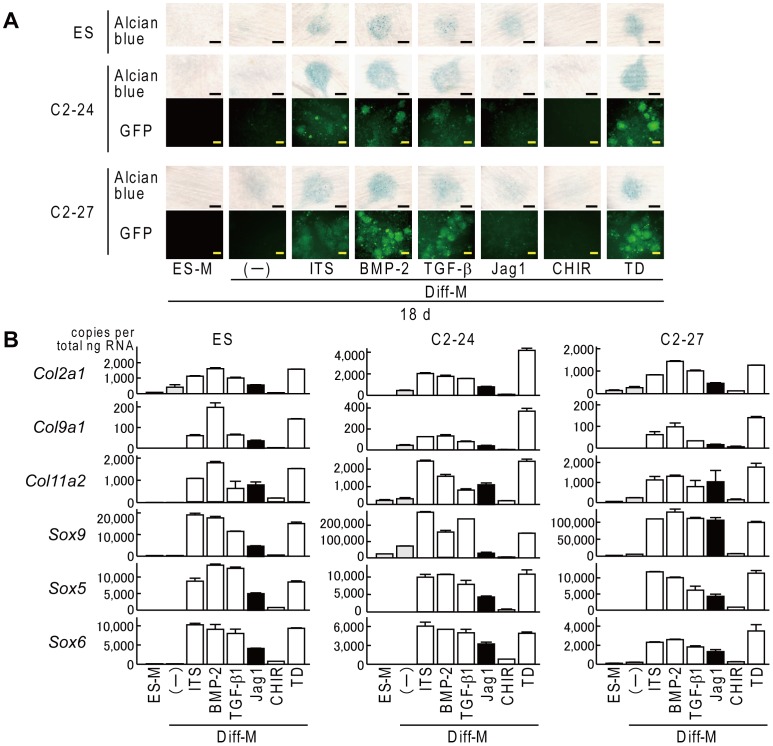
Figure 4. Fluorescence during chondrogenic differentiation of ES, C2-24, and C2-27 in high cell-density micromass culture.
(A) Alcian blue staining and fluorescent view. ES-M: ES medium, Diff-M: basal differentiation medium, Jag1: Jag-1 peptide, TD: TD-198946. Scale bars, 20 mm for Alcian blue staining and 50 µm for fluorescent view. (B) mRNA levels of chondrocyte-specific collagen genes and Sox genes. Data are expressed as means (bars) ± SDs (error bars) for four wells/group.

