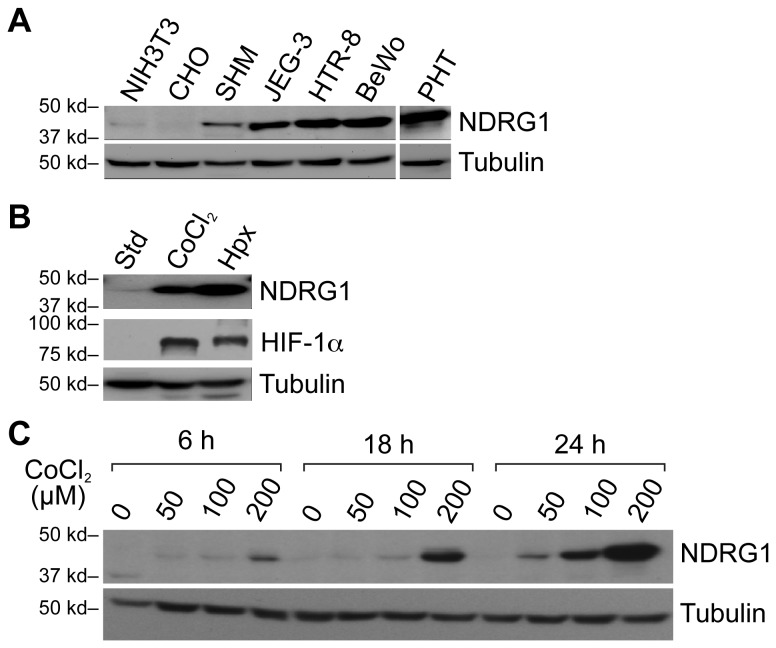
Figure 1. NDRG1 expression in trophoblast cell lines in response to hypoxia or CoCl2.
NDRG1 (upper panels) and tubulin (loading control, lower panels) were detected using Western immunoblot. (A) NDRG1 expression in trophoblasts and trophoblast-derived choriocarcinoma cell lines, as well as in other cell types under standard conditions. (B) NDRG1 expression in JEG-3 cells cultured in standard conditions, 24 h of hypoxia (<1% O2) or the hypoxia mimetic CoCl2 (200 µM). The expression of HIF-1α (middle panel) confirmed the effect of CoCl2 or hypoxia. (C) A time course and concentration-dependent stimulation of NDRG1 expression in JEG-3 cells exposed to the hypoxia mimetic agent CoCl2. Data are representative of at least three independent experiments.

