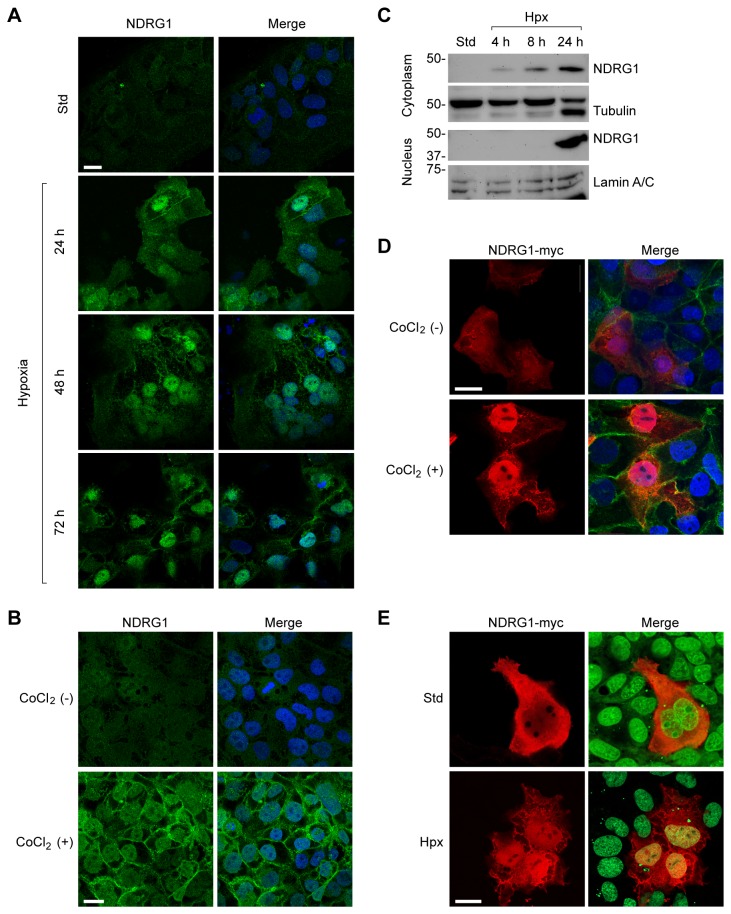
Figure 3. The sub-cellular localization of NDRG1 in response to hypoxic injury.
Wild type or myc-tagged NDRG1, as well as cell nuclei, were detected as described in Materials and Methods. (A) The impact of hypoxia on NDRG1 expression level and localization in PHT cells exposed to hypoxia at the time period indicated. NDRG1 (green) is shown in the left panels, and a merged channel of NDRG1 and nuclei (blue) is shown in the right panels. (B) JEG-3 cells were exposed to CoCl2 (200 µM) for 24 h, and data analyzed as in (A). (C) A Western immunoblot of NDRG1 expression in the cytoplasmic (upper panel) or nuclear (lower panel) fraction of JEG-3 cells cultured in standard or hypoxic conditions for the period of time indicated. Tubulin and lamin A/C were used as markers of the cytoplasm and nucleus, respectively. (D) The impact of CoCl2 (200 µM for 24 h) on the localization of myc-tagged NDRG1 in JEG-3 cells. Myc-tagged NDRG1 (red), E-cadherin (green), and nuclei (blue) are shown. (E) The impact of hypoxia (24 h, <1% O2) on the localization of myc-tagged NDRG1 in BeWo cells. Myc-tagged NDRG1 (red) and nuclei (green) are shown. Data are representative of at least three independent experiments. Bar = 20 µm in all panels.

