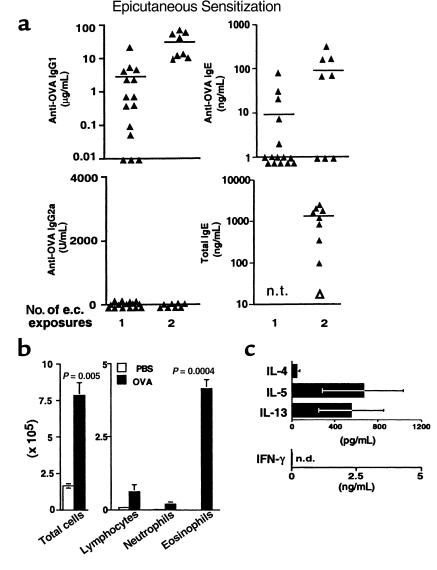
Figure 1.
Th2 responses after e.c. OVA exposure. (a) Mice were exposed to e.c. OVA (100 μg) under an occlusive skin patch either once (on day 0) or twice (on days 0 and 14). Serum was obtained for measurement of antibodies by ELISA on days 13 and 27. Data points represent values for individual mice with the mean indicated and are from 4 experiments. The open triangle at the bottom right represents the value for pooled preimmune serum. n.t., not tested. (b) Mice initially exposed epicutaneously to either OVA (100 μg) in PBS or PBS alone on day 0 were challenged with i.n. OVA (25 μg) on days 14, 15, 18, and 19. On day 21, mice were sacrificed, BAL was performed, and total cell yield and differential counts in cytospin preparations from individual mice were determined. Both the total number of cells recovered by BAL and the number of each cell type are shown. Data are reported as mean ± SEM of 3 (PBS) or 5 (OVA) mice per group. One representative experiment of 3 experiments with similar results is shown. Statistical significance between PBS-exposed and OVA-exposed groups was determined by unpaired Student’s t test. (c) After BAL on day 21, lungs from 5–10 mice initially exposed to e.c. OVA were harvested and pooled. Inflammatory cells were isolated by enzymatic digestion. Cells were restimulated in vitro by culture with OVA (100 μg/mL) for 48 hours. Cytokine levels in supernatants were measured by ELISA. Data are reported as mean ± SEM from 2 experiments. n.d., none detected. Cytokine levels in cultures without OVA: IFN-γ, n.d.; IL-4, n.d.; IL-5, 156 pg/mL; IL-13, 59 pg/mL. No cytokines were detected in cultures of lung cells from naive mice with or without OVA treatment.

