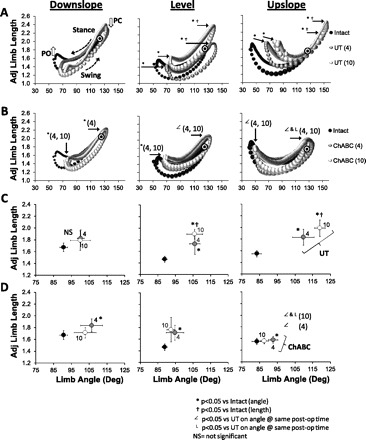
Fig. 6.

Hindlimb kinematics during treadmill locomotion. A and B: plots of hindlimb angle (x-axis) vs. adjusted hindlimb length (y-axis) are shown for downslope, level, and upslope walking. Data from Intact rats and from rats 4 and 10 wk after nerve transection are shown for Untreated rats (UT; A, n = 3 for 4 and 10 wk) and ChABC-treated rats (B, n = 5 for 4 wk and n = 4 for 10 wk). Data from injured rats are always in the foreground. The size of the symbols is proportional to the average SE from the y- and x-axes (i.e., larger bubbles indicate larger variance about the mean). In the downslope panel of A open arrows are next to inflection points in the polygon corresponding to the time at which the paw leaves the treadmill belt (i.e., paw-off, PO) and paw contact with the treadmill belt (PC). Stance and swing and the direction of the advancement of the step cycle (counterclockwise) are depicted in this panel as well. In A and B solid arrows point to angles and/or femur lengths of postoperative rats at PO and PC that were significantly different from Intact rats, and in some cases for ChABC data that were different from UT data. Black-and-white targets identify maximal femur lengths from Intact rats when postoperative data obscured Intact data. C and D: average (±SE) positions of these measures of hindlimb position from the same data shown in A (Intact and postinjury, UT) and B (Intact and postinjury, ChABC).
