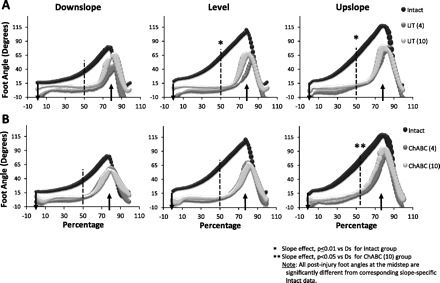
Fig. 8.

Kinematics of the foot. Values of foot angle throughout the step cycle for downslope, level, and upslope walking starting with paw contact are displayed for Intact rats (n = 8) in A and B as black bubbles in the background. A also shows injured rats at 4 and 10 wk (n = 3 for both injured groups) after sciatic nerve transection and repair without additional treatment. B also shows data for injured rats treated with ChABC at the time of injury at 4 (n = 4) and 10 (n = 3) wk after sciatic nerve transection and repair. Paw contact is identified with a vertical arrow pointing down that crosses the x-axis. An arrow pointing up crosses the x-axis where the swing phase generally begins. A vertical line is located at 50% through the step cycle. The sizes of the symbols are proportional to the SE (i.e., larger bubbles indicate larger variance about the mean).
