
Fig. 1.
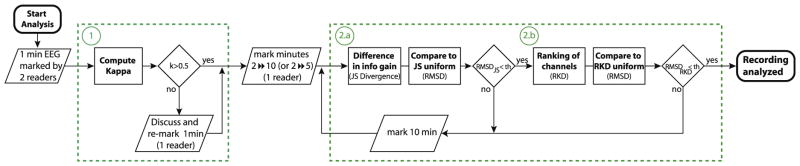
Diagram of the complete process. First step: Assessing concordance between readers based on Kappa coefficient (1). Second step: Evaluating if an interval is representative of the whole marked EEG, in terms of rates (2a) and ranking of channels (2b).