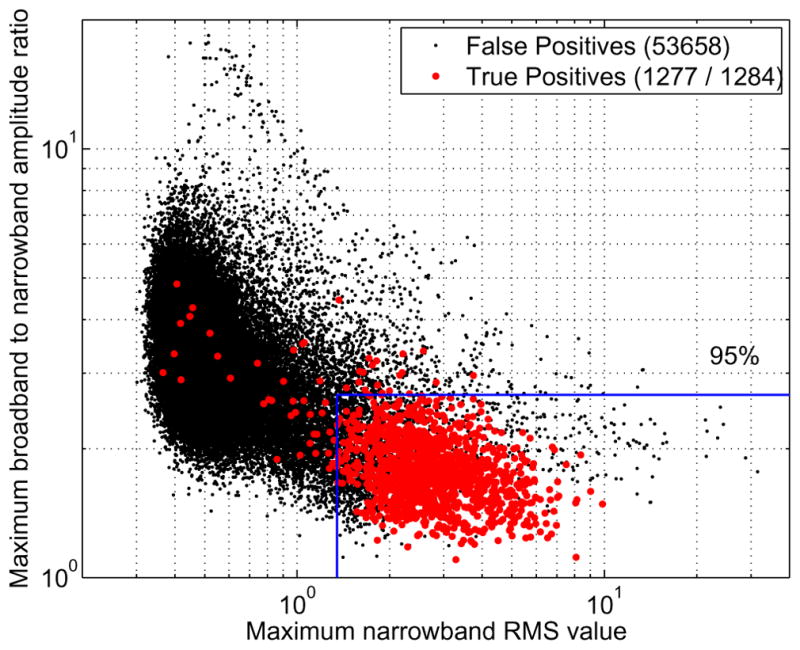
Fig. 2.

Feature values of the events after the detection stage, for the 15 patients set. Each point corresponds to a subject level event, and is either a true or false positive based on the expert’s marks. The number of events is given in the legend. An example of threshold values used for the classification is also shown, corresponding to the optimum threshold values to obtain 95% sensitivity considering all the patients as training data.
