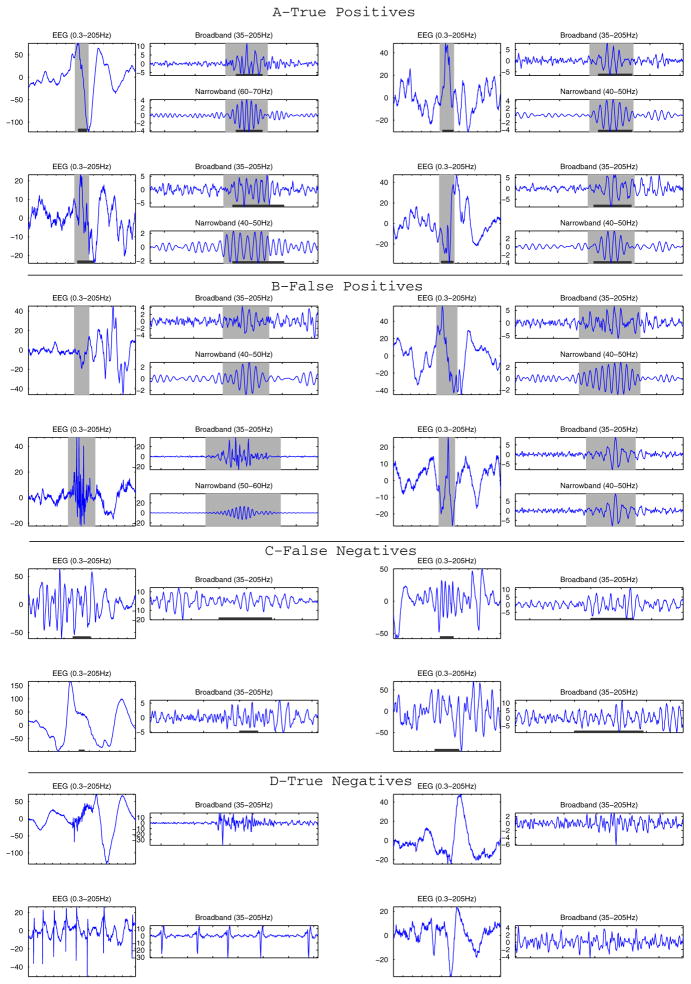
Fig. 3.
(A) Example of true positive events illustrating clear events marked by the expert and identified by the detector. (B) Examples of false positive events; some look like genuine FOs that may have been missed by the expert and others are clearly part of artefacts. (C) Example of false negatives: these events marked by the expert but were not very clear and probably for this reason were missed by the detector. (D) True negatives show transients that were not marked by the expert and not detected. Gray background indicates detections of the automatic detector and dark lines at the bottom of the figures are expert’s marks. The EEG signal (0.3–205 Hz) and the broadband signal (35–205 Hz) are shown for each event, and the narrowband signal at which an event was detected are shown for the true and false positive detections. The Amplitude is given in μV, the ticks in the time axes correspond to 100 ms intervals.

