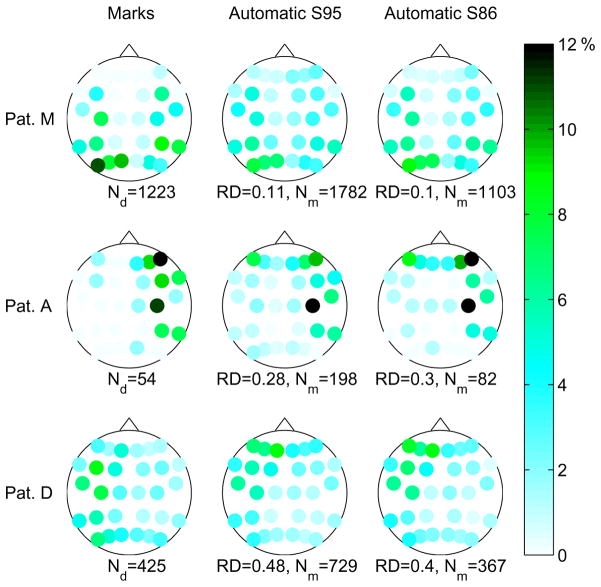
Fig. 5.
Channel involvement results. Every dot corresponds to a bipolar channel on the scalp. The color/gray level of the dots indicates the proportion of events in that particular channel. Left: distribution of expert’s marks. Center and right: distribution of detections of automatic detector at operating points S95 and S85, respectively. The total number of events is given below each diagram, as well as the ranking distance (RD) value for the automatic detector. Results are shown for three patients with different RD values.

