Fig. 2.

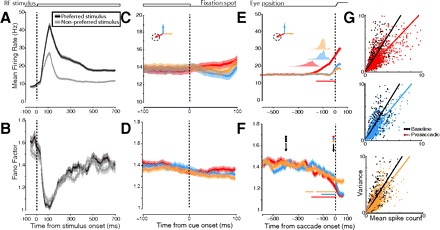
Effects of RF stimulation and saccade preparation on the mean firing rate and response variability for the population of area V4 neurons. Left: mean firing rate (A) and Fano factor (FF; B) aligned to the time of RF stimulus onset and divided into responses to preferred vs. nonpreferred visual stimuli. These traces, as well as those in C–F, are all smoothed with an 80-ms box filter (see methods). C and D: mean firing rate and FF aligned to movement cue onset (i.e., fixation offset) and split by direction of saccade. E and F: the same but aligned to saccade onset. In all traces, means (dark lines) and SE (shading) are shown. In E and F, horizontal bars indicate significant difference from delay period. In E, translucent plots above traces show distributions of cue onset times relative to saccade onset. G: data from individual neuron-conditions for 2 time points: baseline and immediately prior to saccade onset. Each dot represents the mean and variance of spike counts within an 80-ms window for just 1 neuron-condition (those trials corresponding to a particular neuron, stimulus, and saccade direction). Black dots represent variance/mean pairs taken from windows during the baseline period of each saccade condition (1st arrow in F). Colored dots represent variance/mean pairs taken from windows just prior to saccade onset (2nd arrow in F). Thick lines are linear regressions on the data.
