
Fig. 4.
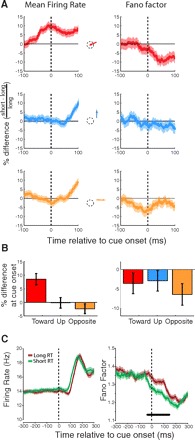
Relationship of presaccadic mean firing rate and FF to saccadic RT for the population of V4 neurons. A, left: traces show percent difference in mean firing rate between short and long reaction time (RT) trials for each saccade condition. Right: percent differences in FF. B: differences in mean firing rate and FF for short and long RT trials in each saccade condition at the time of the movement cue (t = 0). C: same data as in A but collapsed across the 3 saccade conditions. Horizontal bar indicates a significant difference between long and short RT traces.