
Figure 5. Principal coordinate cluster plots of bacterial communities.
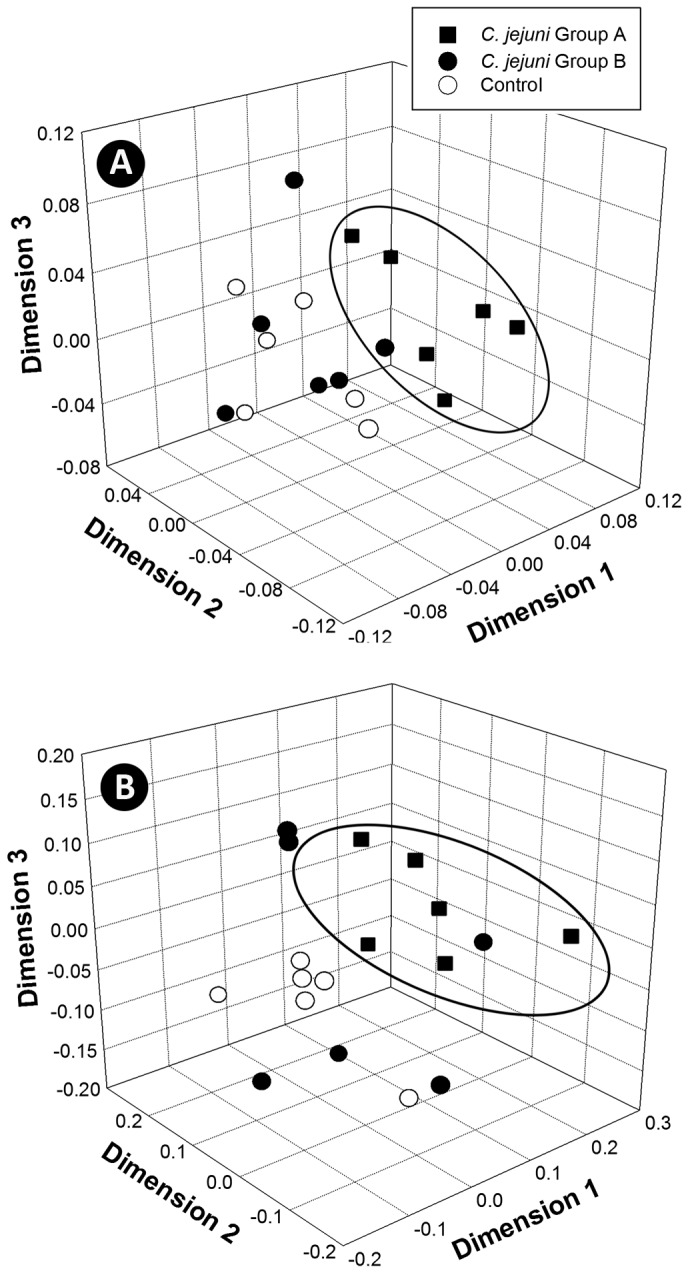
Plots depict community composition similarities based on pyrosequence analysis of: (A) weighted; and (B) unweighted datasets subsampled to an even depth. Treatments are: C. jejuni Group A (8.8 log10 copy number of C. jejuni g-1 of cecal tissue); C. jejuni Group B (6.4 log10 copy number of C. jejuni g-1 of cecal tissue); and control (not inoculated with C. jejuni). The ellipsoids show predominant clustering of bacterial communities in C. jejuni Group A mice relative to C. jejuni Group B and control mice.