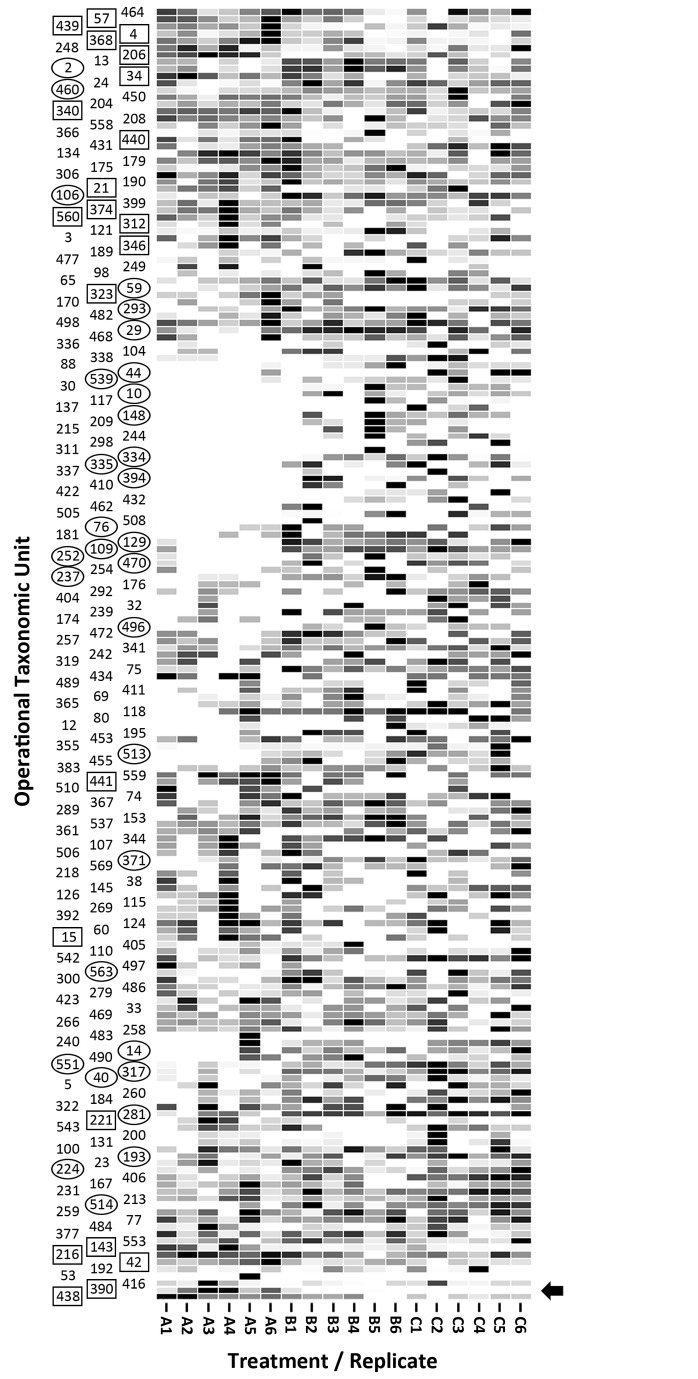
Figure 7. Heat map of sequence frequencies.
The map shows the relative prevalence of 183 OTUs by mouse within treatment (i.e. OTUs in which ten or more sequences were observed). Treatments are: (A) C. jejuni Group A (8.8 log10 copy number of C. jejuni g-1 of cecal tissue); (B) C. jejuni Group B (6.4 log10 copy number of C. jejuni g-1 of cecal tissue); and (C) control (not inoculated with C. jejuni). The arrow indicates the OTU corresponding to C. jejuni (i.e. #390). OTU within circles represent OTU that occur conspicuously less frequently in C. jejuni Group A relative to C. jejuni Group B and Control mice. OTU within boxes represent OTU that occur conspicuously more frequently in C. jejuni Group A relative to C. jejuni Group B and Control mice. A list of taxonomic classifications by OTU is available in Table S1.

