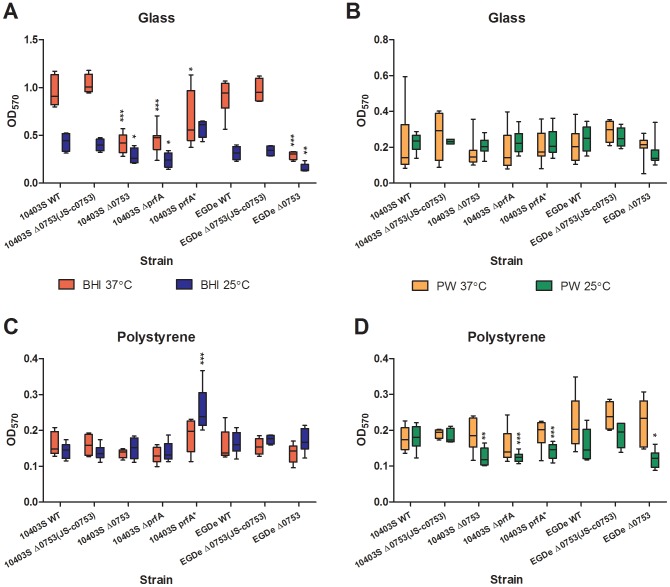
Figure 2. Biofilm production of L. monocytogenes strains.
The bacterial biofilm formation is quantified by OD570 readings. A) Quantification of biofilm formation in glass test tubes. B) Quantification of biofilm formation in polystyrene 96-well plates. Middle horizontal line in each box represents the median of the entire data set; the upper and lower horizontal lines represent the upper quadrant median and the lower quadrant median, respectively. Standard deviations represent three independent experiments. Significant differences in comparison to the parent strains under the same condition are shown as * (P<0.5), ** (P<0.001), and *** (P<0.0001).

