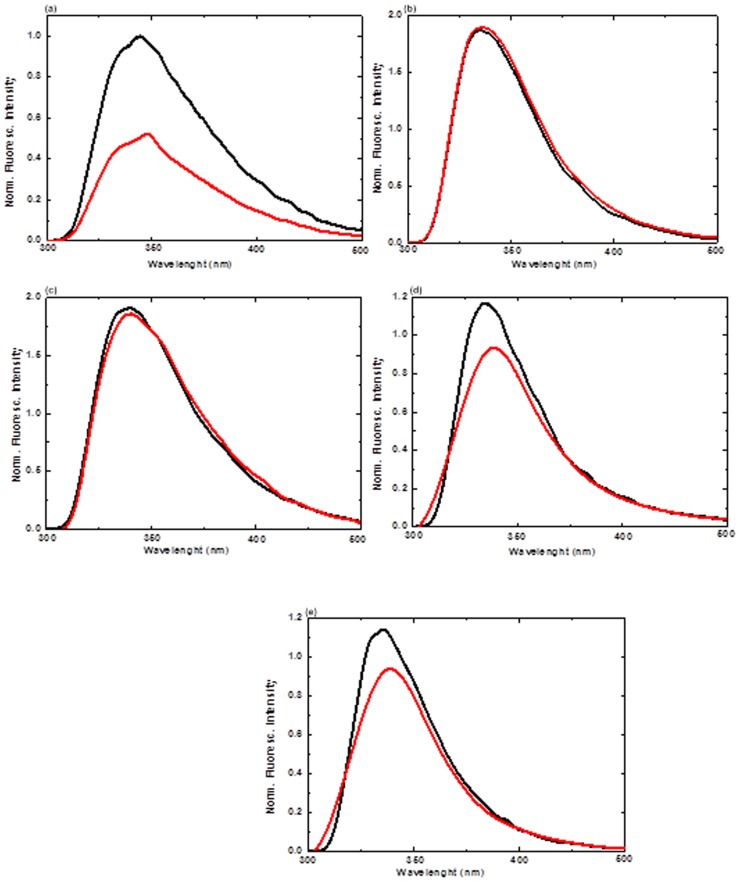
Figure 6. Fluorescence spectra analysis of the CT in (a) buffer, (b) 1 M TEAP, (c) 1 M TEAS, (d) 1 M [Bmim][Cl] and (e) 1 M [Mim][Cl] at 25°C, where the ILs are used without treatment with AAPJ for 5 min are in black colour and the treated ILs are in red colour.
The data points are average values of at least six determinations, the error bars indicating ±mean deviation.

