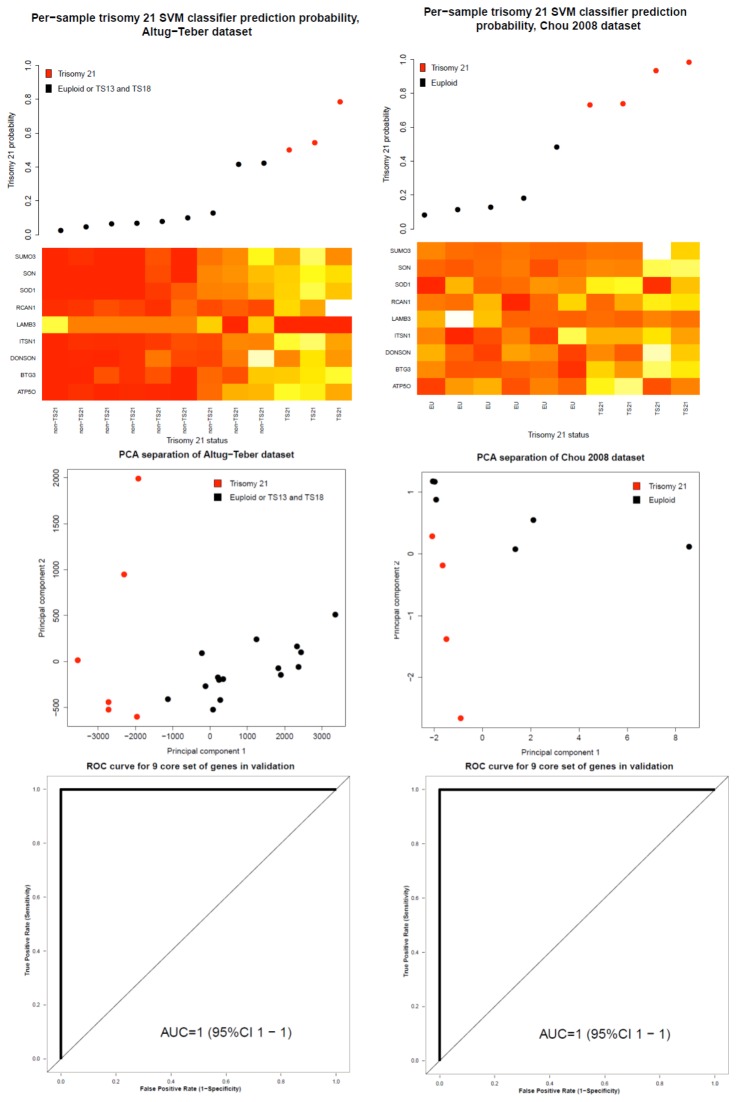
Figure 4. Validation of results, based on data from studies by Altug-Teber et al [3] and Chou et al [13].
In the upper part of the figure, the per-sample predictions based on the expression profiles of 9 gene biomarker are displayed, with predicted probability of positive Ts21 status presented on y axis. The color of the dots represent the actual karyotyping diagnostic result. Below, heatmap representing gene expression level for each sample (heatmap rows) and for each gene (heatmap columns) is presented. The expression of 8 genes tends to be comparatively increased in samples with true trisomy 21 status, while expression of LAMB3 is directed oppositely, towards down-regulation in Ts21 samples. In the heatmap yellow color represents higher expression and red color lower expression level, where values have been scaled separately per each row. Middle part of the figure represents principal component analysis of 9-gene expression for samples expression profiles published in [3,13]. In the bottom part, plots representing ROC-based classification performance of 9-gene expression biomarker may be observed.

