
Fig. 3.
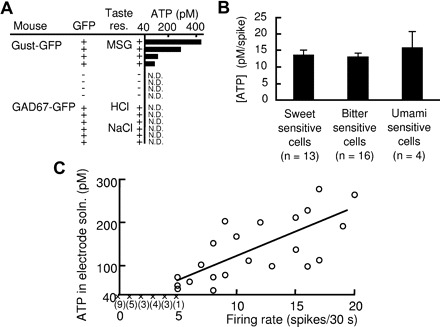
Tastants elicited ATP release from type II cells but not from type III cells. A: ATP concentrations in solutions of the recording electrode attached to type II cells in response to an umami compound (MSG, 300 mM) and in type III cells in response to sour (HCl, 10 mM) or salty (NaCl, 300 mM) compounds. + under “Taste res.,” responsive to a taste compound indicated; −, irresponsive; N.D., not detectable (detection limit, 40 pM). B: ATP concentrations per spike released from type II cells in response to sweet, bitter, or umami compounds. C: correlation between spontaneous firing activity and ATP release from type II cells: ○, ATP detected and quantified; ×, ATP not detectable (detection limit, 40 pM). The numbers of sampled cells in which ATP was not detectable are shown in parentheses. The fitted line was drawn with the ATP-detected samples (r = 0.71).