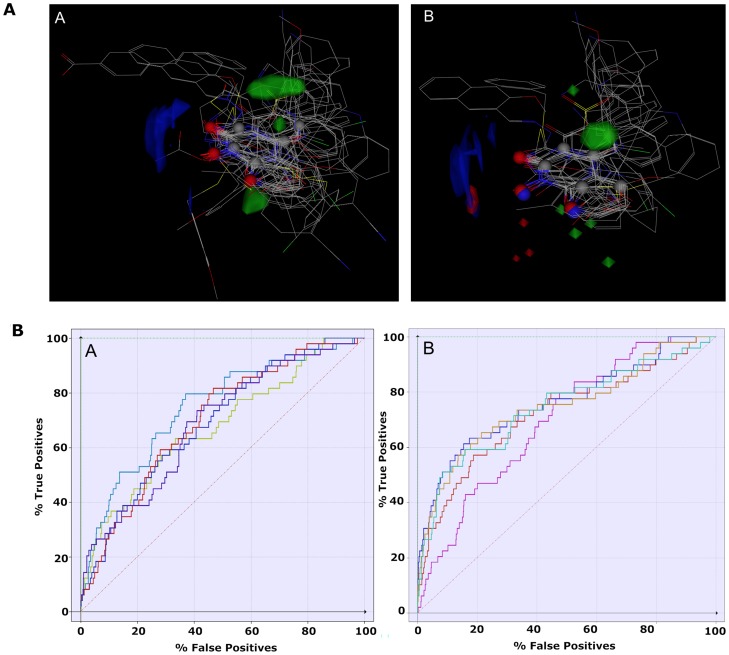
Figure 8. FLAP Models.
Panel A. Pseudomolecule (Pharmacophoric atoms) shown (left) in gray/blue/red spheres with aligned molecules (wire representation), modified model 1 (right). GRID 3D molecule interaction fields (MIFs) of models are shown as follows: The green contours correspond to the DRY probe (energy level −0.63 kcal/mol), blue contours correspond to the N1 probe (energy level −3.83 kcal/mol) and red contours correspond to the O probe (energy level −1.50 kcal/mol). Panel B. Enrichment plot of screening for 20 known actives from 971 inactive compounds from the PubChem database. Enrichment plot of model 1–4 (left), Enrichment plot of modified model 1–4 (right).

