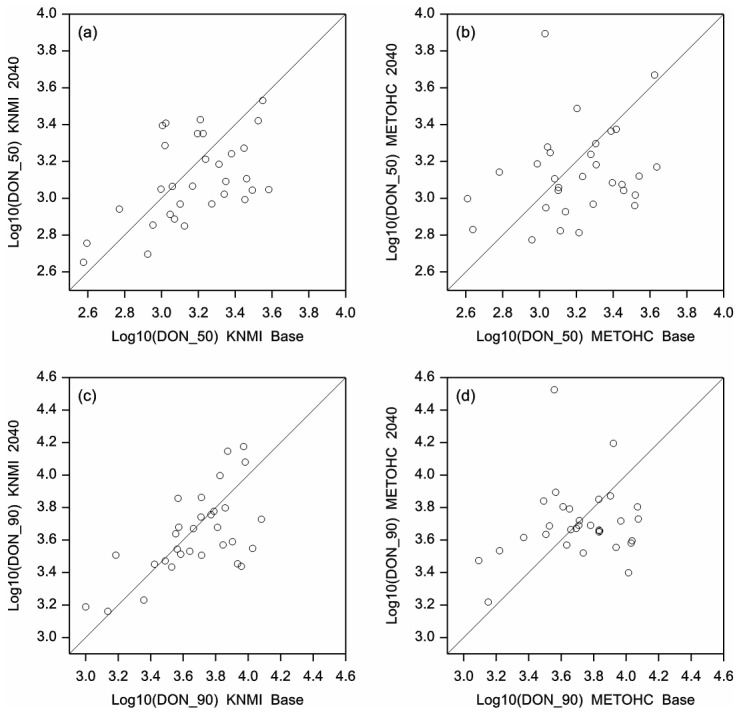
Figure 4. Estimated future DON concentration.

Estimated DON concentration (log transformed, in μg kg-1) in the future scenario period (2031-2050) relative to the baseline period (1975-1994) using the KNMI model (left panels) and the HC (right panels) climate model data. DON contamination is expressed in both 50th and 90th percentile values.
