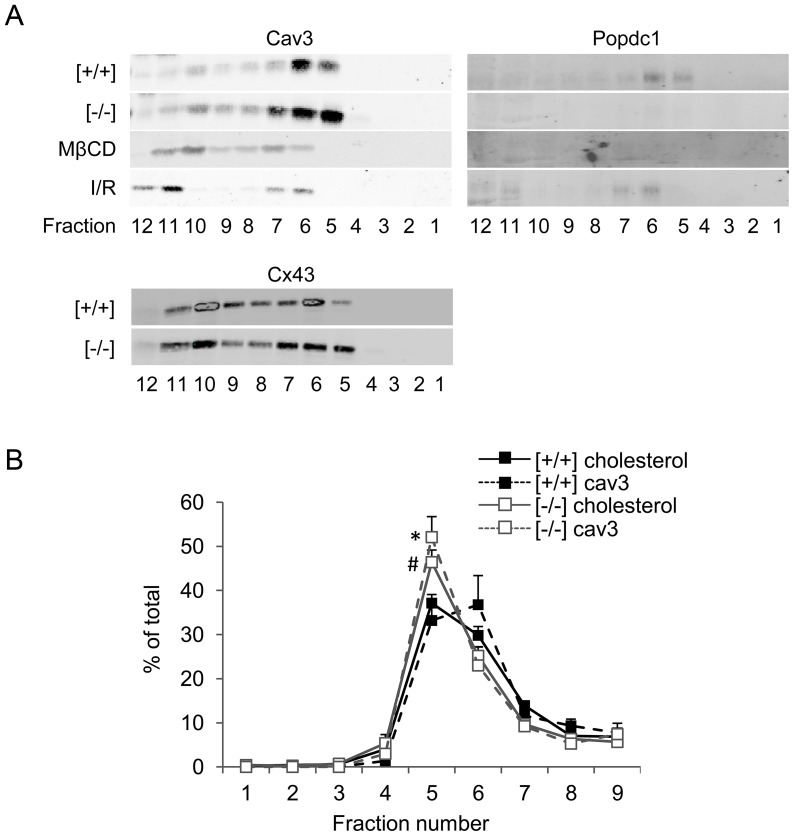
Figure 3. Popdc1 density sedimentation in discontinuous sucrose gradients.
(a) Western blot analysis of gradient fractions. Fraction 1 and fraction 12 represent the lowest and highest density, respectively. [+/+], WT; [−/−], Popdc1-null; MβCD, methyl-β-cyclodextrin; I/R, ischemia/reperfusion; Cx43, connexin43. The molecular weights of the reactive bands were ∼68 kDa, ∼22 kDa, and ∼43 kDa, for Popdc1, Cav3, and Cx43, respectively. (b) The relative distribution of cholesterol and Cav3 throughout gradient fractions 1–9. *P<0.05, Cav3 in fraction 5, Popdc1-null vs. WT; #P<0.05, cholesterol in fraction 5, Popdc1-null vs. WT.

