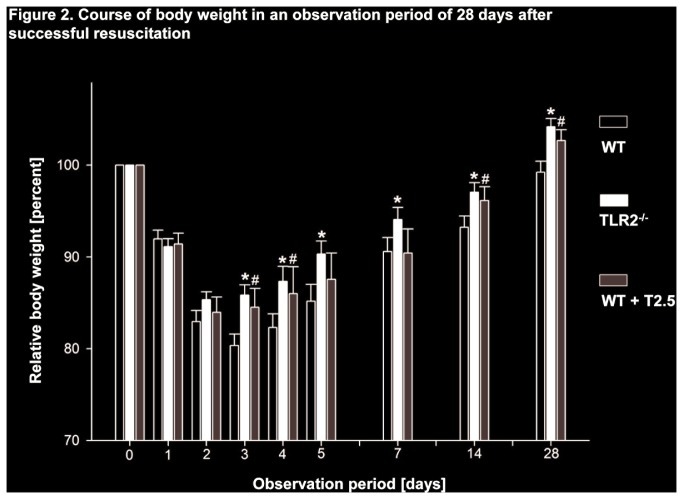
Figure 2. Course of body weight in an observation period of 28 days after successful resuscitation.
Course of mouse body weight before (day 0) and following CA/CPR within the 28-day observation period displayed as relative body weight to compared to day 0. Data is presented as mean ± SD and was analysed by One-way ANOVA followed by Bonferroni test for multiple comparisons. White columns WT, black columns TLR2-/-, grey columns WT+T2.5. *P < 0.05 WT vs. TLR2-/-; #P < 0.05 WT vs. WT+T2.5.

