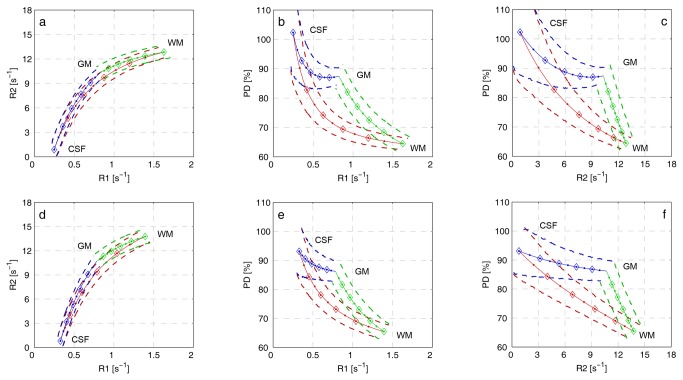
Figure 3. Lookup grids formed by joining together the 95% prediction ellipses of the 3,000 simulated partial-volume clusters (dashed lines).
The transition GM↔WM is shown in green, WM↔CSF in red and WM↔CSF in blue. The top panels a-c shows the results for 1.5 T and the bottom panels d-f shows results for 3.0 T. The solid lines represent the observations in the absence of noise where each diamond corresponds to a change of 20% tissue fractions and each dot correspond to a change of 10% tissue fractions. R1-R2-PD space is projected on a, d) R1-R2, b, e) R1-PD and c, f) R2-PD planes.

