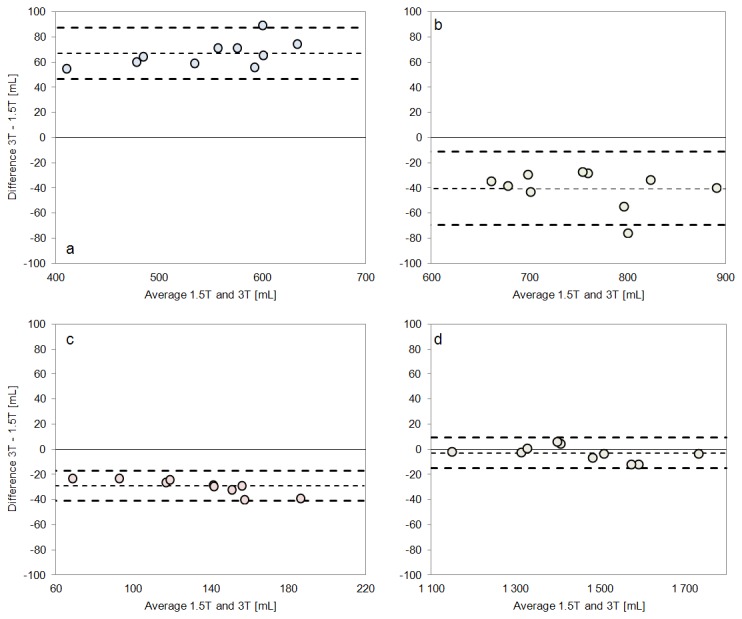
Figure 5. Bland-Altman plots comparing the volumes between 1.5 T and 3.0 T.

Volumes of a) WM, b) GM, c) CSF and d) ICV for all 10 subjects measured at 1.5 T and 3.0 T. The dashed lines indicate the limits of agreement and the mean of all measurements (bias).
