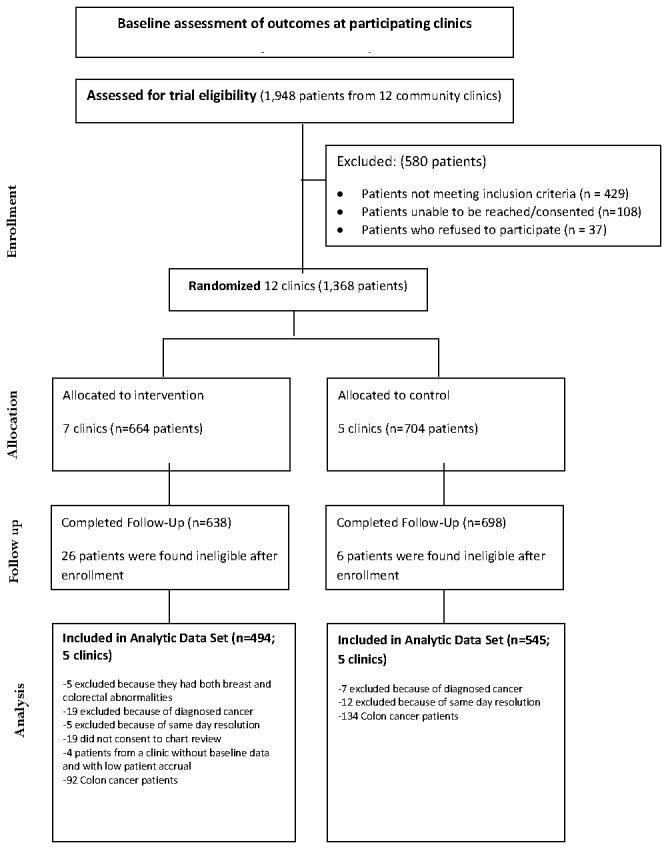
Figure 1. CONSORT flow diagram of Tampa PNRP and Patients with Breast.

Cancer Screening Abnormalities. This is partially modified from the previous our study report for the different analytic data set (page 1665; Figure 1) [19].

Cancer Screening Abnormalities. This is partially modified from the previous our study report for the different analytic data set (page 1665; Figure 1) [19].