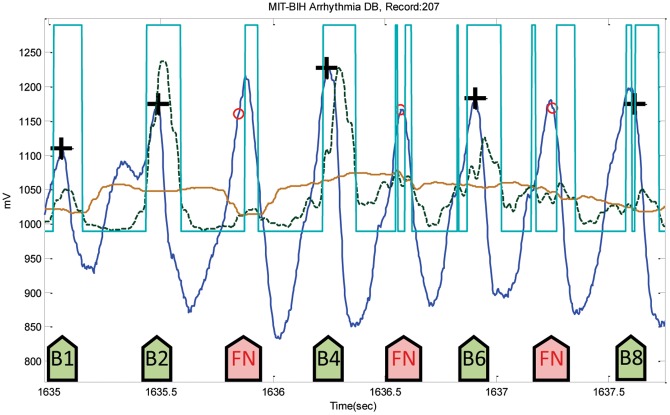
Figure 10. Ventricular flutters in Record 207-MITDB.
The dotted line is the first moving average  , and the solid line is the second moving average
  . The green arrows point to successful detection, while the pink arrows point to failures. Here, the black plus sign represents successful detection produced by the proposed algorithm, where the red circle represents FN.

