Figure 3. Forest plot for the synthesis of 37 articles (40 trained cohorts) identified in the systematic review.
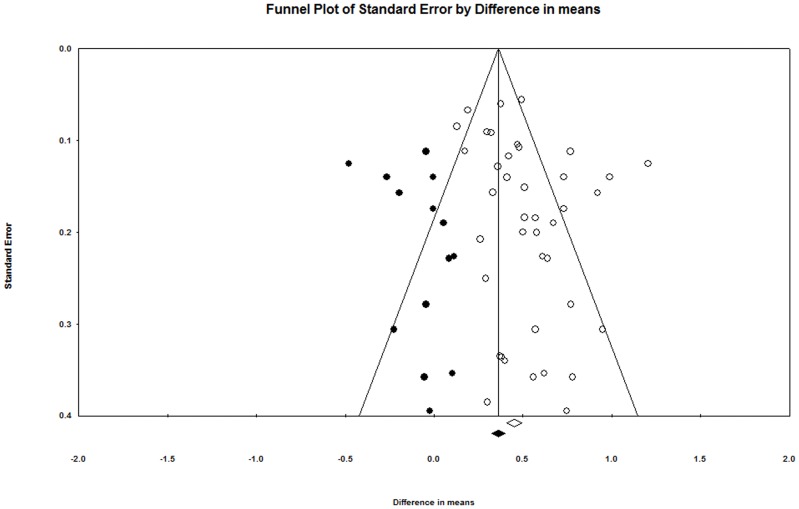
The estimates reported for each study are the means and 95% confidence intervals for the change in VO2max in L · min−1. The summary diamonds at the bottom of the plot represent the summarized effects using fixed and random effects models, where the random effects estimates are considered the primary findings for this study due to heterogeneity (I2 = 70). The estimated increase in VO2max as a result of interval training was 0.51 L · min−1 (95% CI: 0.43 to 0.60 L · min−1; p<0.001).

