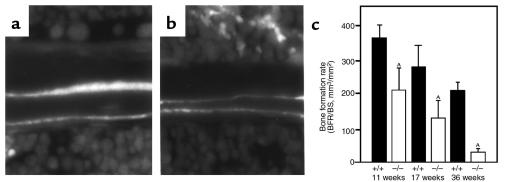
Figure 5.
Trabecular bone-formation rate in tibiae of control (+/+) and osteonectin-null (–/–) mice. In vivo dual calcein labeling allows an estimate of bone-formation rate, which considers the distance between 2 fluorescent labels. Representative data from 11-week-old control (a) and osteonectin-null (b) mice are shown. Bars show mean ± SEM (n ≥ 4). AP < 0.01 between control and mutant mice, as determined by 2-way ANOVA.

