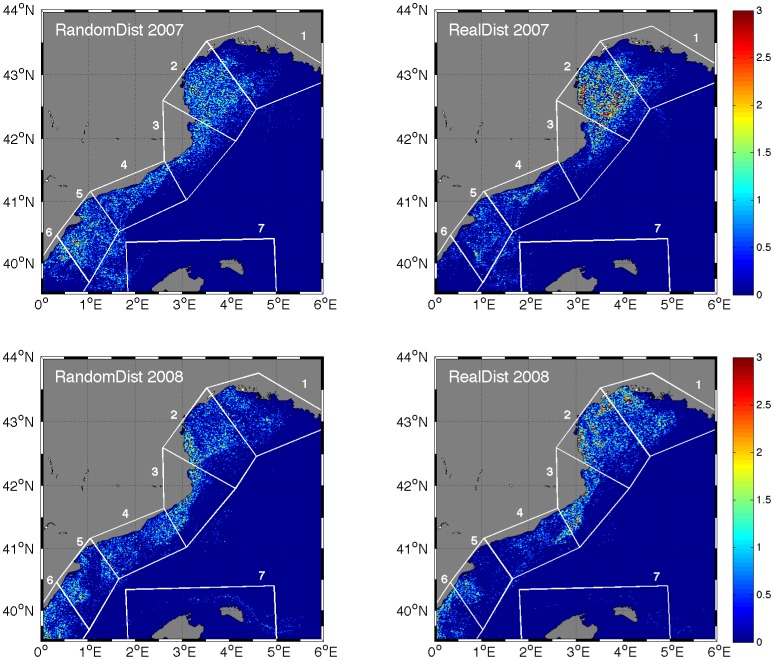
Figure 5. Simulated horizontal distributions of anchovy larvae at 14 mm from the SEIBM in RandomDist and RealDist experiments.
The two plots on the top are the output of RandomDist and RealDist experiments establishing the spawning date at  of June 2007; on the bottom, establishing the spawning date at
  of June 2008. The type of experiment is indicated in the upper left corner of each map. The color-scale represents larval density. The pre-recruitment zones are numbered: 1- GoL East, 2- GoL West, 3- Palamós, 4- Barcelona, 5- Ebro delta, 6- GV and 7- Balearic Islands.

