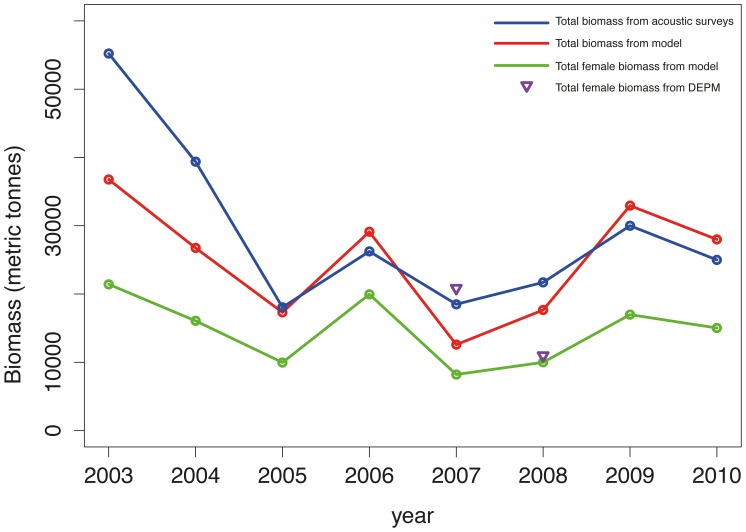
Figure 9. Female and total biomass in GoL from 2003 to 2010.
The blue line corresponds to the total biomass estimated from acoustic surveys by IFREMER. The red and green lines correspond to the total and female biomass predictions from GAMs, respectively. The inverted triangles are the total biomass estimated from DEPM surveys by CSIC-ICM.

