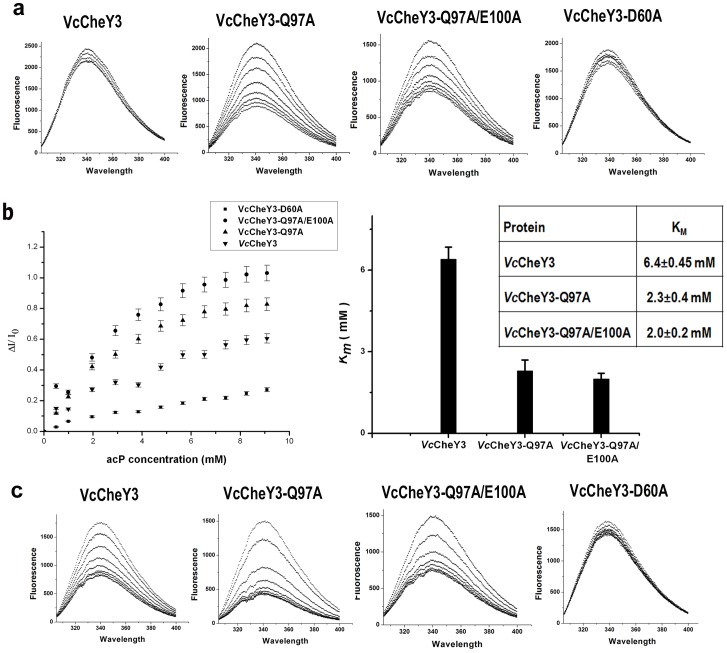
Figure 3. Activation of VcCheY3 and its mutants, measured through fluorescence quenching.
(a) Tryptophan quenching of VcCheY3 and its different mutants (indicated at top of the figure) using acetyl phosphate (acP) as substrate. (b) Plot of ΔI/I0 vs acP concentration (in mM) and corresponding Km values (both in graphical and numerical modes); (c) Tryptophan quenching of VcCheY3 and its different mutants (indicated at top of the figure) using BeF3 − as substrate.

