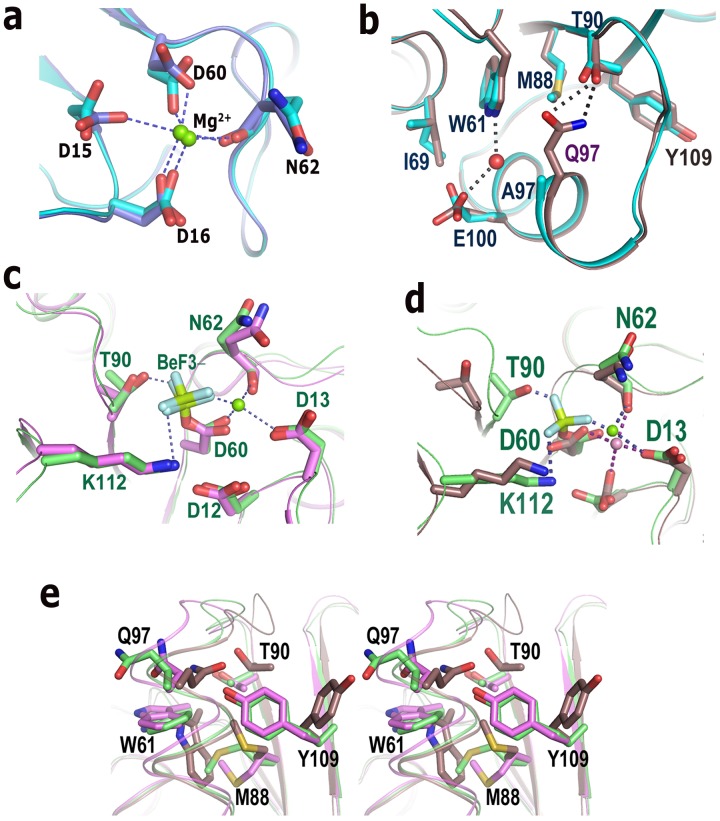
Figure 4. Mg2+ binding, activation of VcCheY3 and comparison with EcCheY.
(a) Comparison of the Mg2+ binding in VcCheY3 (blue) and VcCheY3-Q97A (cyan); (b) superposition of VcCheY3 (violet) and VcCheY3-Q97A (cyan) showing that the hydrogen bond between Q97 and T90 does not directly influence the conformation of W61 and M88; (c) comparison of the active site of VcCheY3-BeF3 − (green) with EcCheY3-BeF3 − (magenta); (d) comparison of the active site of VcCheY3-BeF3 − (green) with free state VcCheY3 (violet); (e) stereoscopic representation comparing the ‘in’ position and the conformation of the neighbouring residues in VcCheY3-BeF3 − (green), EcCheY3-BeF3 − (magenta) with respect to VcCheY3 (violet).

