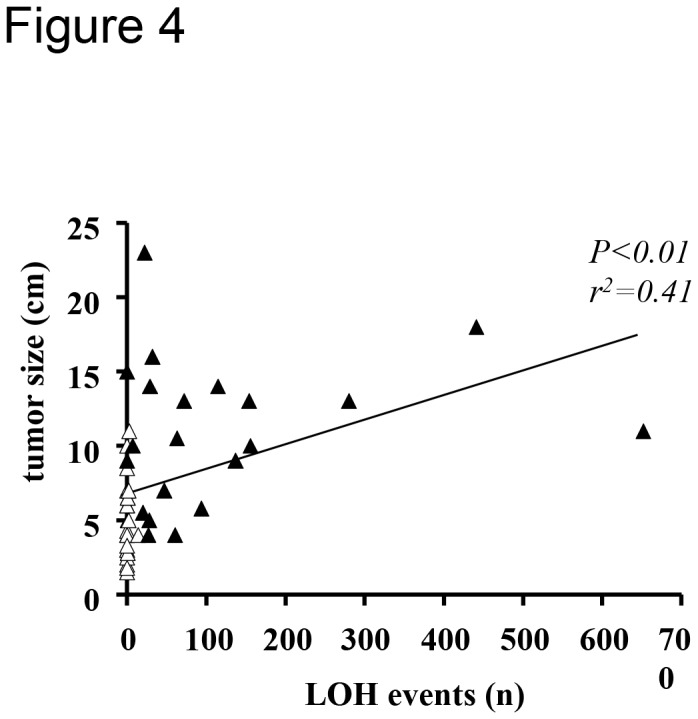
Figure 4. Correlation between the total number of LOH events and tumor size.

All the evaluated adrenocortical tumors (n=46) were included in the analysis by linear regression analysis. White triangles = adenomas (n=24), black triangles = carcinomas (n=22).
