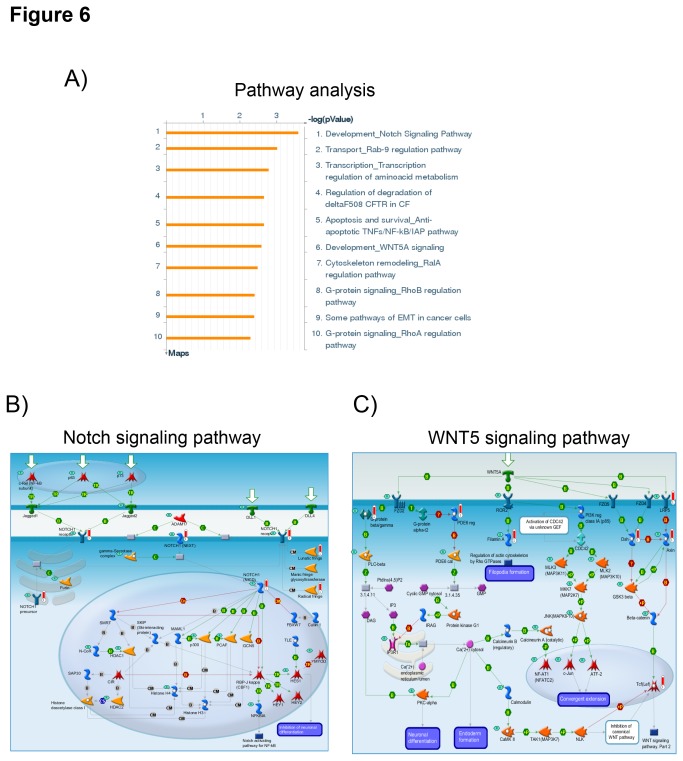
Figure 6. Pathway analysis for genes frequently affected by copy number alterations in both adenomas and carcinomas.
A) List of the most significantly altered pathways according to the GeneGo analysis (Meta Core Analytical suite) including all the genes (n=696 annotated genes) with copy number alterations observed in at least 4 samples (recurrent CNA) in both adenomas and carcinomas. The P values are expresses as logarithmic scale. B) Graphical representation of the Notch signaling pathway map (gene ontology enrichment, P=2.913 e-4).
C) Graphical representation of the WNT5 signaling pathway (gene ontology enrichment, P=3.256 e-3).
Genes with gains are underlined in red and genes with losses in blue. Detailed legend is available at http://pathwaymaps.com/pdf/MC_legend.pdf.

