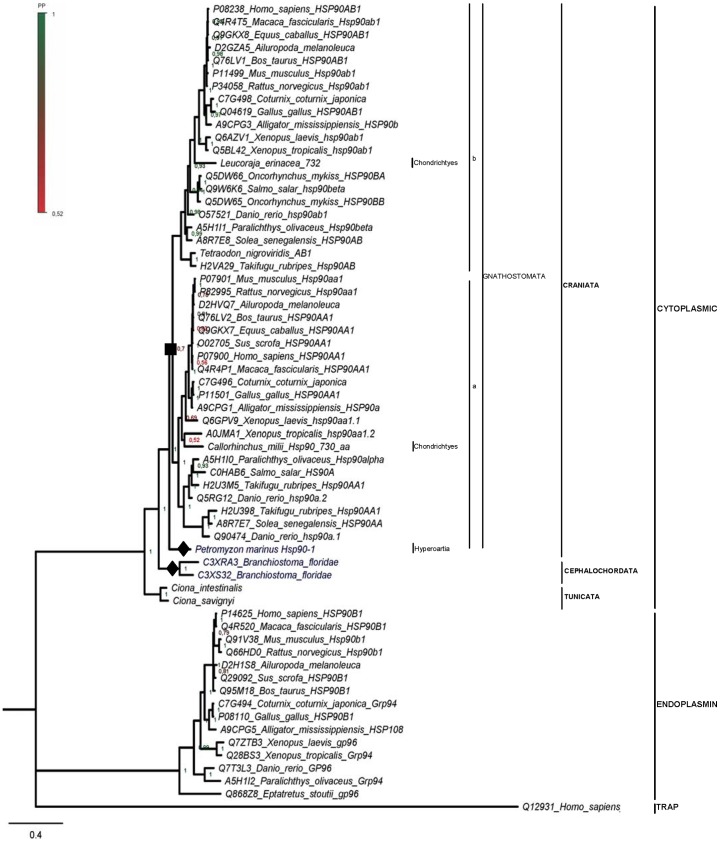
Figure 4. Bayesian inference phylogenetic tree based on Hsp90 protein sequences from Chordata.
Species in which multiple hsp90 genes have been detected are in dark blue. Filled diamonds denote putative species-specific duplication events, predicted by this study. Filled square denotes the duplication event resulting in the cognate and inducible isoforms of vertebrates. Numbers at nodes represent Posterior Probability (PP) values. Scale bar: substitutions/site.

