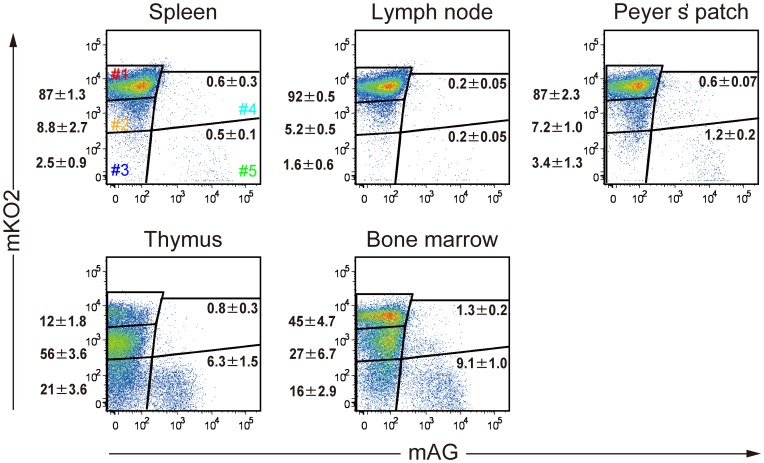
Figure 3. Flow cytometric profiles of Fucci signals in immune cells from various organs of #639/#474 mice.
Single-cell suspensions from spleen, lymph node, Peyer’s patch, thymus, and bone marrow of #639/#474 mice were prepared and subjected to flow-cytometric analysis in order to analyze the levels of mAG and mKO2 signals. Data are representative of three individual experiments. Numbers in dot plots indicate mean ± S.D. of gated cells.

