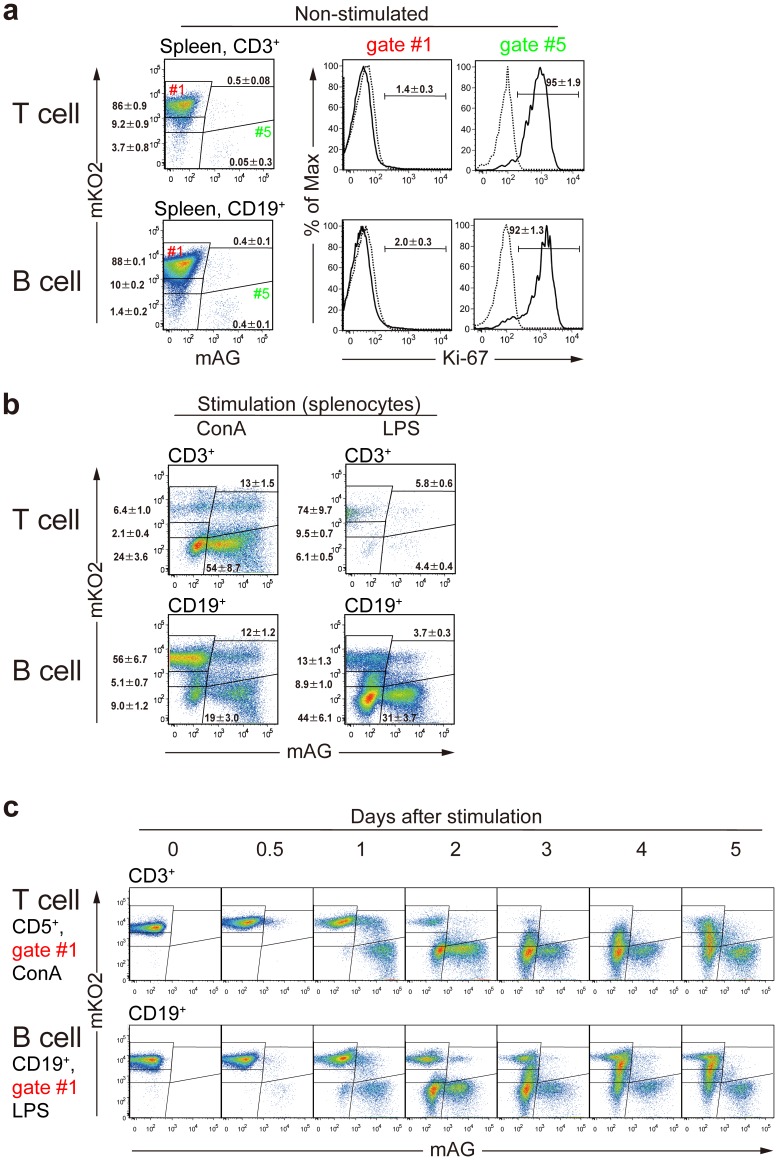
Figure 4. Stimulation-induced changes in Fucci signals in various immune cell subsets isolated from #639/#474 mice.
(a) Splenocytes from #639/#474 mice were stained with APC-anti-CD3 mAb or APC-anti-CD19 mAb. Using flow cytometry, non-stimulated T and B cells were collected as CD3+ and CD19+ fractions, respectively. The cells were fixed and stained with Alexa 647-conjugated anti-Ki-67 mAb (solid line) and Alexa 647-conjugated control mAb (dotted line). The signals of Alexa 647 of cells in gate #1 and gate #5 are shown. (b) Cultured splenocytes were stimulated for 2 days with ConA and IL-2 or LPS, and T cells and B cells were gated as CD3+ and CD19+ cells, respectively. Data are representative of three individual experiments. Numbers in dot plots and histograms indicate mean ± S.D. of gated cells. (c) Sorted mKO2++ T cells (CD5+, gate #1) or B cells (CD19+, gate #1) were cultured with ConA or LPS, and Fucci-signals were analyzed at indicated time points. Data are representative of two individual experiments.

