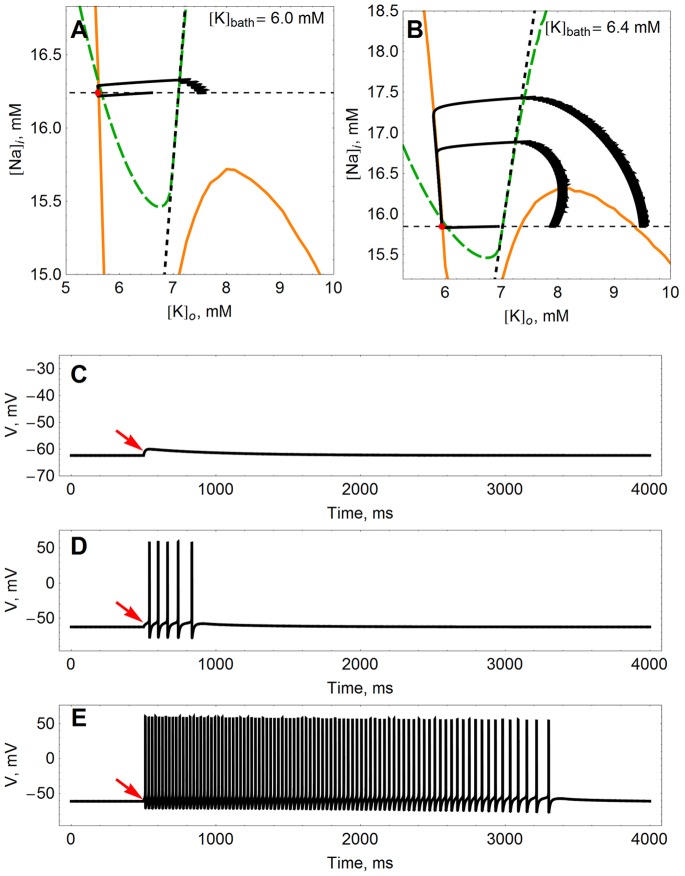
Figure 5. Response of the model to an instantaneous increase in  –the K nullcline as a bursting threshold.
The position of the nullclines changes with  , and so too the response of the model to an instantaneous increase in
  . In the phase planes (A) and (B), the equilibrium point is denoted by a red dot. From this equilibrium, we perturb the model by sliding out along the horizontal dashed line. The black curves show the trajectories of the model recovering from stimuli of different sizes. Potassium (orange) and sodium (dashed green) nullclines are drawn in each case. Also shown is the SNIC curve that marks the onset of spontaneous spiking (short-dashed line running approximately vertically). (C) shows a voltage time trace of the small response from (A), (D) shows the larger of the transients shown in (A), and (E) shows the largest transient in (B). The perturbation from equilibrium occurs at the arrows (
 ms).
ms).

