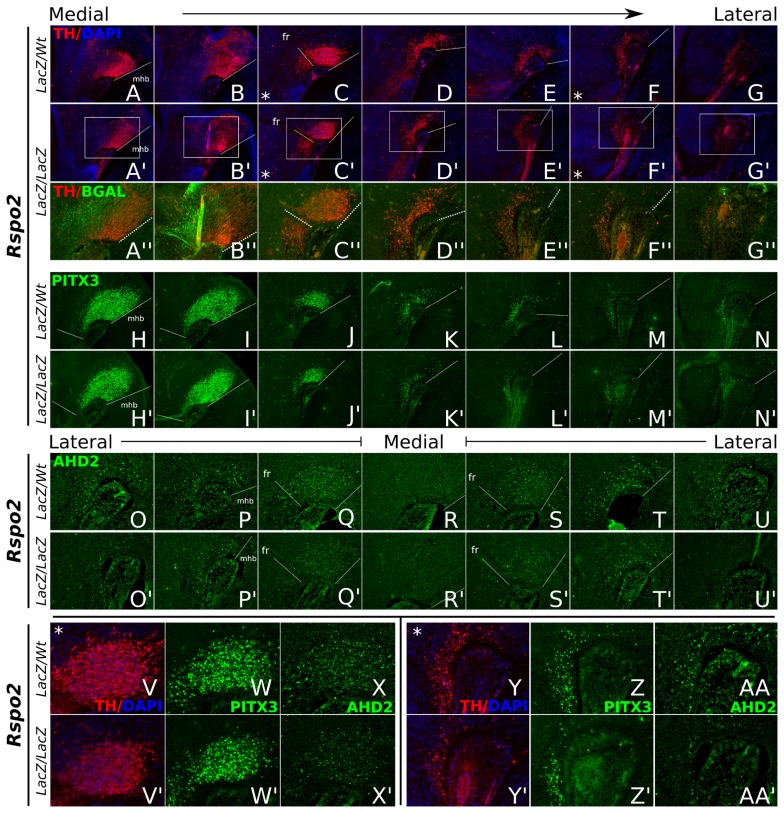
Figure 7. mdDA markers TH, AHD2 and PITX3 display loss of expression in Rspo2-LacZ/LacZ embryonic midbrain.
Sagittal sections of Rspo2 control and knock-out (LacZ/LacZ) littermate mouse brains, at E14.5. (A–G′) TH protein expression analysis reveals a decrease in TH+ cells in the Rspo2-ablated mdDA neuronal field. Lines indicating the mid-hindbrain border (mhb) and the fasciculus retroflexus (fr) are added for clarity. (A′′–G′′) More detailed images of (A′–G′). BGAL protein staining can be observed in Rspo2-LacZ/LacZ mutant cells. Most of these cells do not express TH (anymore). (H–N′) A decrease in PITX3-expressing mdDA neurons in Rspo2-LacZ/LacZ tissue is shown. (O–U′) From lateral to medial to lateral, AHD2 analysis reveals a decrease in expression in the paramedian and lateral mdDA neuronal subset, in the absence of Rspo2. (V–X′) Higher magnifications of (C,C′), (J,J′) and (Q,Q′), showing a mild but clear decrease of mdDA neurons expressing TH, PITX3 and AHD2 in the paramedian midbrain. (Y–AA′) Higher magnifications of (F,F′), (M,M′) and (O,O′), showing a clear decrease in the number of TH-, PITX3-, and AHD2-positive neurons in the lateral mdDA neuronal field.

