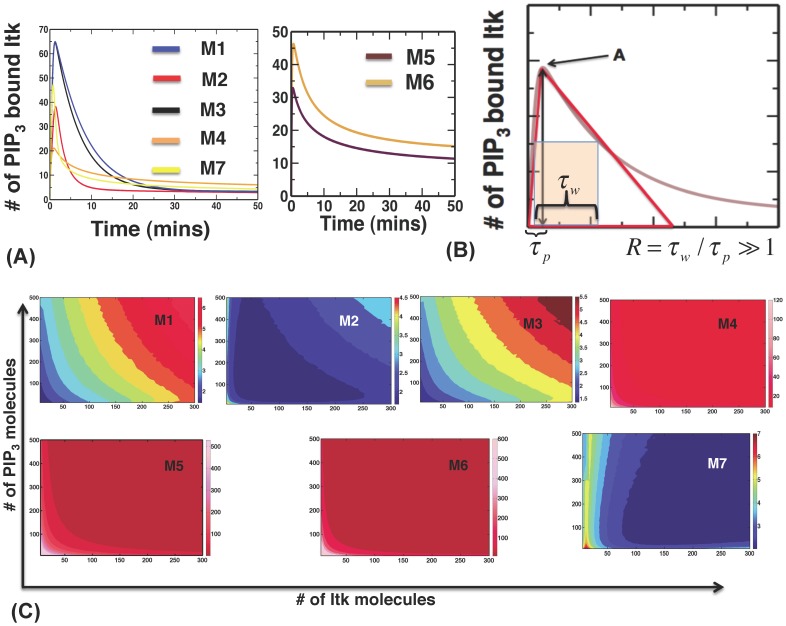
Figure 2. Different molecular interactions in models M1–M7 produce different temporal profiles of PIP3 binding to Itk.
(A) Kinetics of PIP3 association of Itk for fixed initial PIP3 and Itk concentrations (100 and 370 molecules, respectively) in models with feedbacks (M1–M4, and M7, left panel) and no feedbacks (M5–M6, right panel). (B) The shapes of the temporal profiles can be characterized by the parameters peak time (τ p), peak width (τ w), and peak value or amplitude (A). The dimensionless asymmetry ratio R = τ w/τ p quantifies how symmetric the shape of the time profile is. A larger R value indicates larger asymmetry. (C) Variations in R in models M1–M7 for different initial concentrations of Itk and PIP3. Color scales for R values are shown on the right of each panel.

