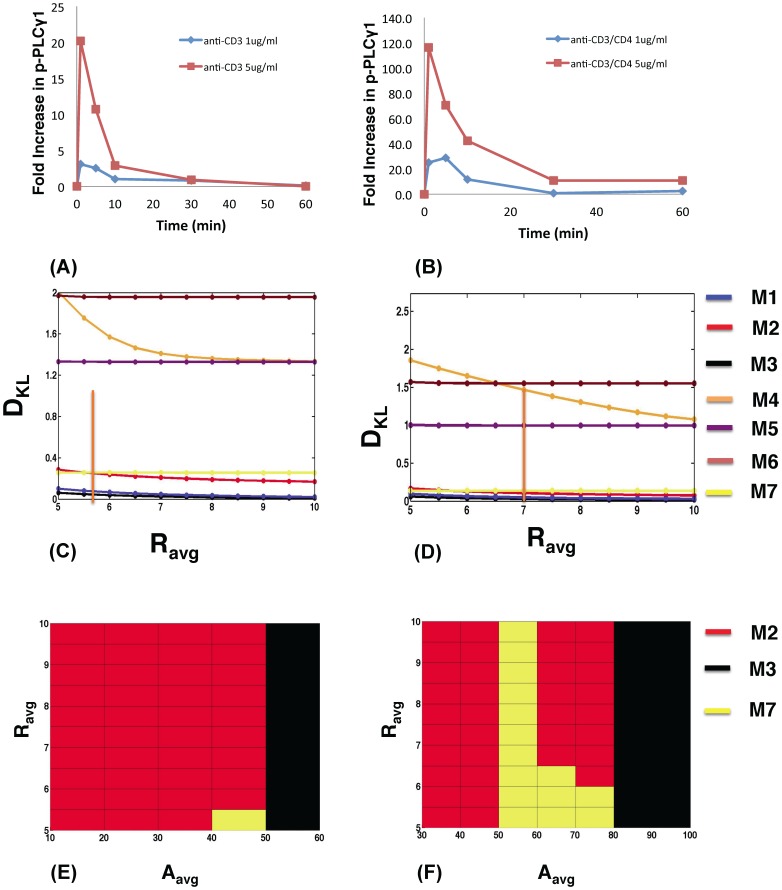
Figure 4. Models containing Itk dimers and dueling feedbacks also show higher robustness for polyclonal T cells stimulated by anti-CD3 antibodies.
PLCγ1 phosphorylation kinetics in MHC−/− T cells stimulated by antibodies against (A) CD3 or (B) CD3 and CD4 at 1 µg/ml versus 5 µg/ml. (C) Variation of DKL with R for the in silico models M1–M3 (blue, red and black, respectively), M7 (yellow), and M5–M6 (purple and maroon, respectively) at initial Itk (Itk0 = 100 molecules) and PIP3 concentrations (PIP3 0 = 370 molecules) at τ p = 1 min and A avg = 60 molecules, representing anti-CD3 stimulation at 5 µg/ml. The orange bar indicates Rexpt. Note we use A avg to represent the amplitude Aexpt in experiments measuring fold change in Itk phosphorylation (see the main text for further details). (D) Variation of DKL with R for anti-CD3/CD4 stimulation at 5 µg/ml at τ p = 1 min and A avg = 80 molecules. The initial Itk (Itk0 = 140 molecules) and PIP3 concentrations (PIP3 0 = 530 molecules) were used. The orange bar indicates Rexpt. (E) and (F) show maps of the most robust models (with the lowest DKL) as Rexpt and A (shown as A avg) are varied for the same parameters as in (C) and (D), respectively.

