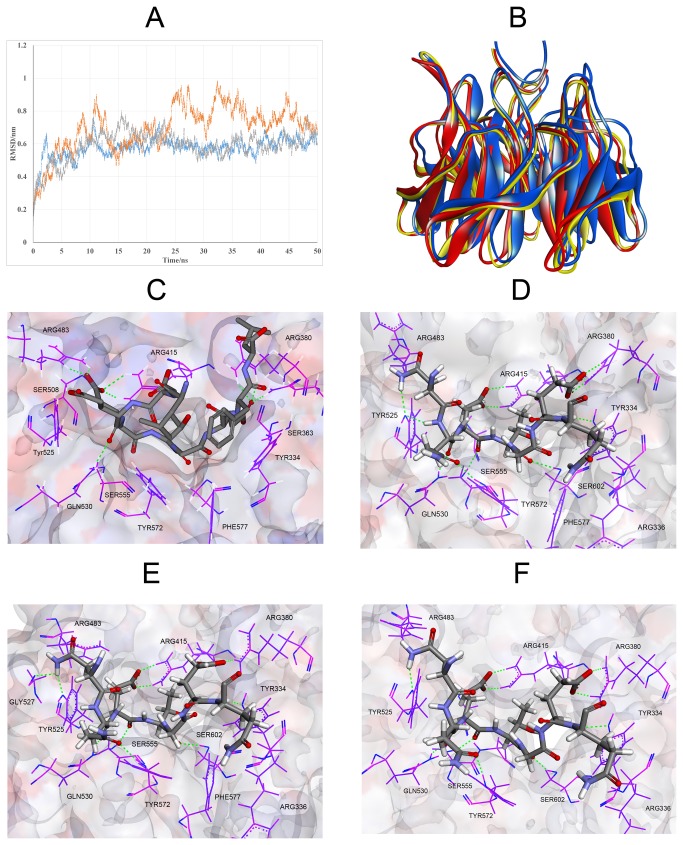
Figure 7. MD simulation of IKKβ-Keap1 complex.
(A) RMSD value of backbone atoms respect to the starting structure (yellow for the first run, gray for the second run and blue for the third run). (B) Superimposition of three representative structures of triplicate MD simulations (coloured as red, yellow and blue). Only the ETGE motif was shown in the figure. The Keap1 DC domain is stable during the simulation. (C) Interaction model of Keap1-Nrf2. (D) (E) & (F) Binding model of three representative structures of triplicate MD simulations. The residues of Keap1 are represented as sticks and the residues of ETGE motif are represented as ball and sticks. Hydrogen bonds are shown as green dashed line.

