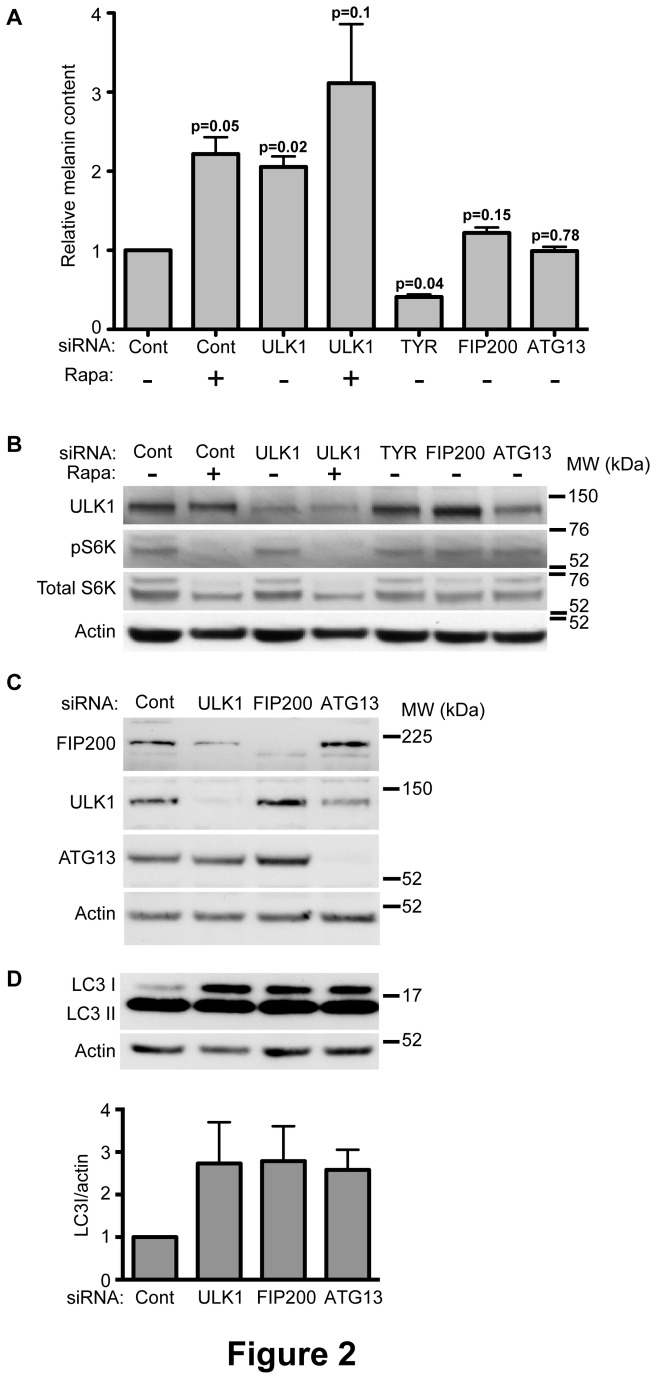
Figure 2. The effect of ULK1 depletion on melanin levels is independent of mTORC1 or the ULK1-ATG13-FIP200 complex.
(A) Cells were treated with ULK1, FIP200, ATG13, TYR or control siRNA. Note: the data from one duplex is shown for FIP200 and Atg13, and a second siRNA duplex for each had identical effects. siRNA transfections were performed on day 1 and 3 after plating, and melanin was quantified on day 6. Control and ULK1 knockdown cells were incubated with 100nM Rapamycin (Rapa, +) or DMSO (-) starting from day 1. The data shown represents at least three individual experiments performed in duplicates, and values are normalized to control samples within each experiment. p values for the differences between the treatments and control were determined by a paired student’s t-test. (B) Cells treated as described in (A) were subjected to western blot analysis. mTORC1 activity was monitored by S6K phosphorylation, showing no significant effect after ULK1 depletion. (C) siRNA depletion of cells treated as in (A) was verified by western blot analysis. (D) Changes in basal autophagy were monitored by LC3-I and LC3-II levels, indicating an inhibitory effect for ULK1, ATG13 and FIP200 depletion in these cells. LC3-I levels were quantified by ImageJ and normalised to actin. Data shown is the mean of values normalized to actin from 4 independent experiments. Errors are SEM.

