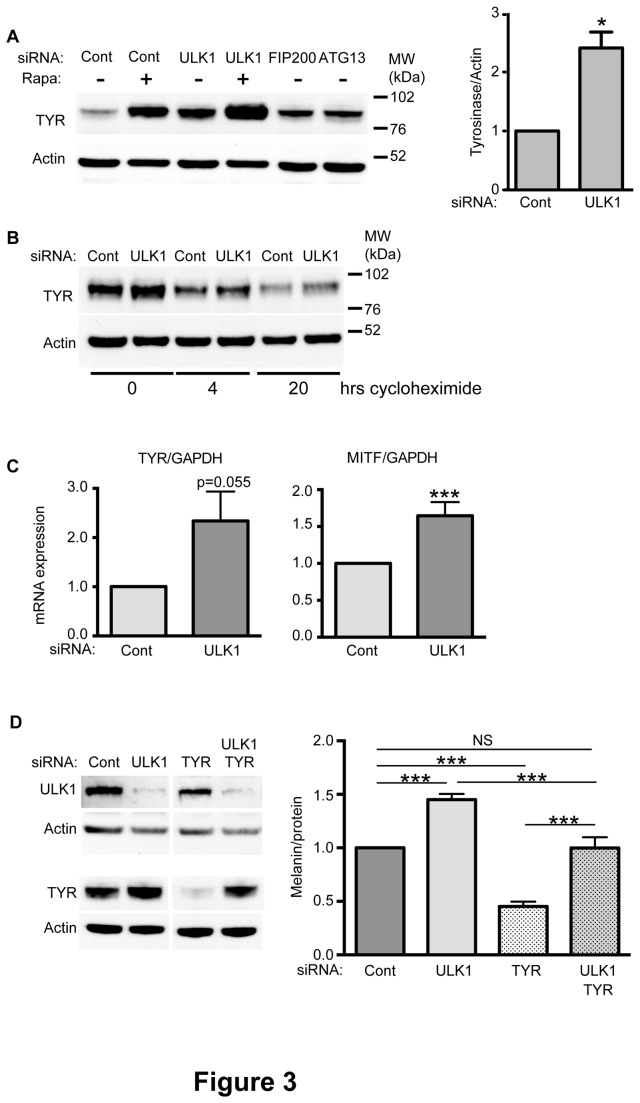
Figure 3. ULK1 knockdown increases TYR levels.
(A) Cells were treated with ULK1, FIP200, ATG13, TYR or control siRNA and Rapamycin (Rapa, +) or DMSO (-) as indicated. Samples were subjected to Western blot analysis. TYR levels in control cells or ULK1-depleted cells were quantified using ImageJ and normalized to tubulin. Data are presented as the mean of values normalized to control within each experiment: * p<0.05; paired student t-test based on four individual experiments. (B) Cells were treated as in (A) with ULK1 or control siRNA. 4 or 20 hrs before harvesting, cells were treated with 100µg/ml cycloheximide added to growth medium. Cells were lysed and processed for western blot for TYR and actin. No difference was detected over 5 independent experiments. (C) Cells were treated as in (A) and harvested and processed for quantitative RT PCR. Data is the mean of 5 independent experiments done in triplicate; statistical significance was determined using an unpaired t-test, **, p<0.01. (D) Cells were treated as in (A) with control, ULK1, TYR or ULK1 and TYR siRNAs, and harvested for western blot for ULK1, TYR and actin or melanin quantification. Data is the mean of 5 experiments normalized to control: *** p<0.001, NS not significant, determined by a one-way ANOVA test.

