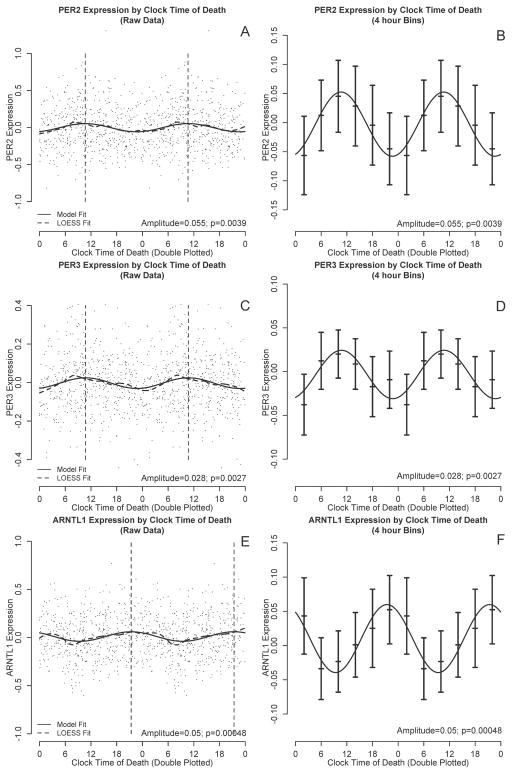
Figure 1. PER2, PER3, and ARNTL1 transcript abundance by clock time of death.
PER2 (A,C), PER3 (B,D) and ARNTL1 (E,F) transcript abundance by time of death considering all subjects together. All six panels are double plotted to assist visualization, although all analyses were based on only a single 24 hour cycle. A, C, E: Black dots indicate raw data. Dashed line indicates nonparametric LOESS regression. Solid line indicates best-fit cosine curve. Vertical lines indicate the timing of the acrophase. B, D, F: Raw data binned into 4-hour intervals. Horizontal lines indicate means and 95% confidence intervals of the mean. Solid curve indicates the best-fit cosine curve based on the raw (unbinned) data.

